Uncertainty Analysis 
We offer partial or full uncertainty analysis for dosimetry program. Source identification and quantification through to full propagation of the total expanded uncertainty in the final dose result.
With our analysis, you can address questions like:
- How does dose level affect the uncertainty in the dose?
- How does the background level affect the uncertainty in the final dose?
- What is the uncertainty in the dose reported for a mixture of fields?
- What is the uncertainty in the calculated dose for an arbitrary set of element readings?
- Will reductions in some of the system uncertainties (calibration, fade, linearity) have a real impact in the uncertainty in the final dose? How much?
 Click here for PowerPoint "Back to Basics" presentation from the 26th Dosimetry and Records conference (June 2007)(3 MB pdf)
Stanford Dosimetry has performed full system uncertainty analysis for both DOELAP and NVLAP accredited dosimetry programs. The process is straightforward: the dosimetry program supplies gross element readings at various levels (to calculate random uncertainty) and estimates of the uncertainties, or boundary values on system factors such as fade, calibration, ECF. We then take this information and combine it to arrive at the total uncertainty in a give element response. If the dose algorithm is also provided, the next step is to propagate these element uncertainties through the algorithm and provide the total propagated uncertainty for a given dose result. A complete document is developed showing the data, methods and results for various dose conditions.
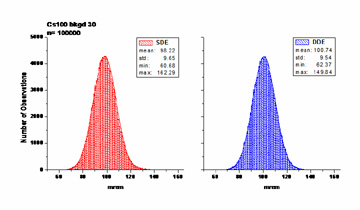
NEWS - The ISO GUM supplement 1 describes utilizing Monte Carlo techniques for the combination and propagation of uncertainties through the entire dosimetry analysis process. Stanford Dosimetry has developed tools to use this new technique. The final result is a distribution of 100,000 doses calculated using the expected element input distributions. (Input = element readings and total combined uncertainty, output is distribution of calculated doses, showing the observed mean and standard deviation for the dose of interest.) This technique is particularly applicable for algorithms like matrix approaches that do not lend themselves to propagation using partial derivatives.
Click here for Power Point presentation at 2006 Dosimetry and Records Conference.
